Metrics Report
This display is visible anytime ANYONE logs into the system. This report is also available when going to the toolbar and clicking on Metrics.
This report shows you statistics based on how your campaigns are functioning and how many Leads you have generated from your funnels.
Now let's break down this report.
At the top left-hand side, you will see three options, Email Metric, Funnel Metric, Income generated. When logging in, you will default to Email Metric. You will click on the other areas to change view.
Email Metric
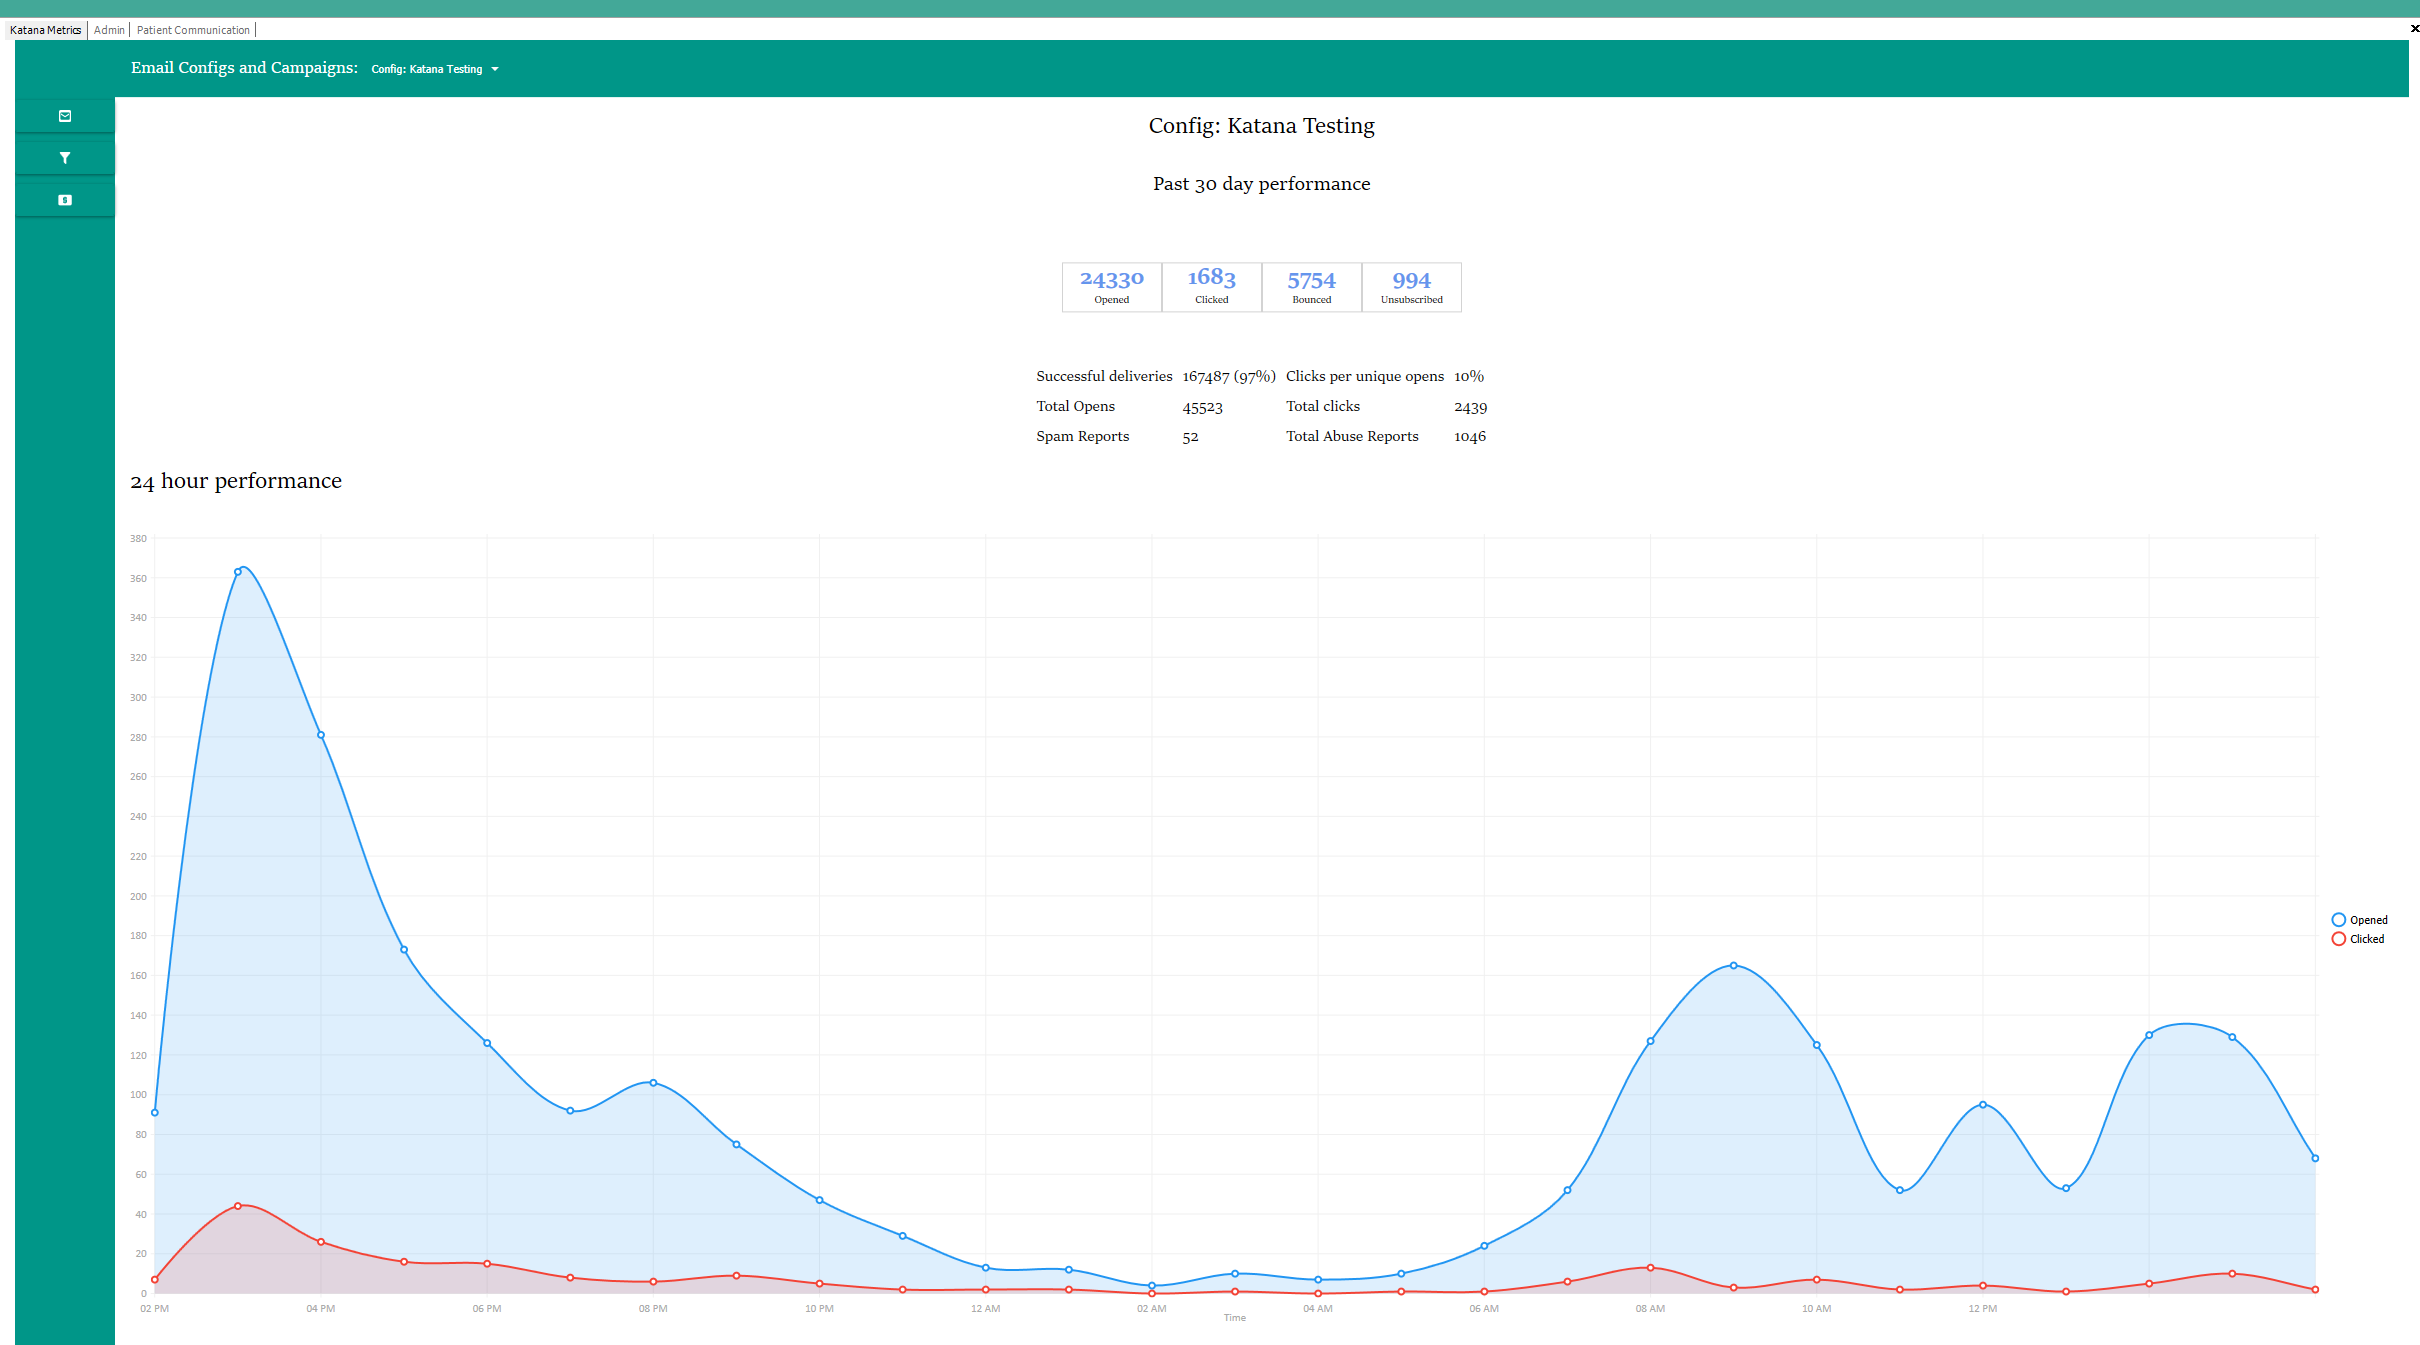
To choose which campaign you would like to look at, you will choose from the dropdown provided at the top of your report.

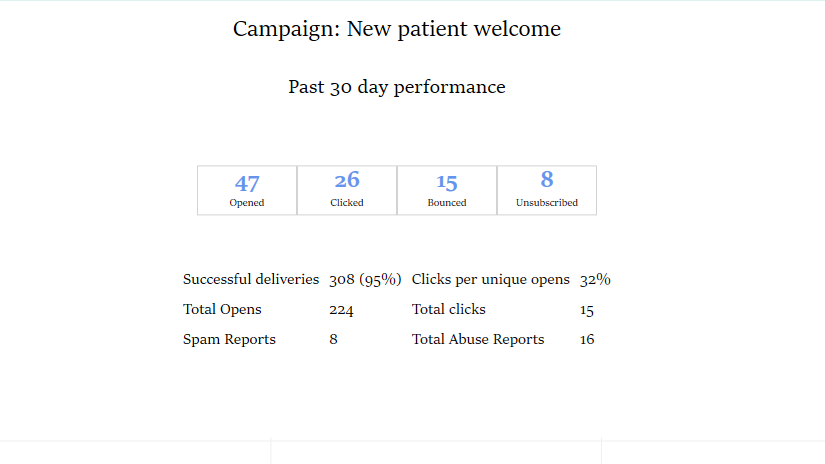
Under Email Matrix, you will see your 30-day performance breakdown of the chosen campaign.
You will see the following:
Initial reactions to your Campaign:
This area only counts the action one time
- Opened- Number of people that opened this specific campaign.
- Clicked- Number of people who clicked on links within the campaign.
- Bounced- Number of emails that were not delivered due to incorrect
- email addresses.
- Unsubscribed- Number of people that unsubscribed from this campaign.
Total Activity to the Campaign:
Total Open and Total Click rates may be larger if a person went in and out of the emails or clicked provided links more than once.
- Successful deliveries: Total amount of recipients that received the campaign and %
- Total Opens: Total number of times email was opened
- Spam Reports: How many people reported the campaign as spam
- Clicks per unique opens: Total clicks/Initial opened rate= Clicks per unique opens
- Total Clicks: Total of times a link was accessed
- Total Abuse Reports: Combines the Spam Complaints + Unsubscribed to = Total Abuse. If you have NO spam rates, this number may mirror unsubscribed.
Currently, in the software there is not a way to see who the patients are in your bounce backs and unsubscribe list but, this WILL be coming in a future update!
To aid, Support will send a "Monthly Email Sending Report" indicating a list of any patients that have unsubscribed/bounced or Spammed your emails.
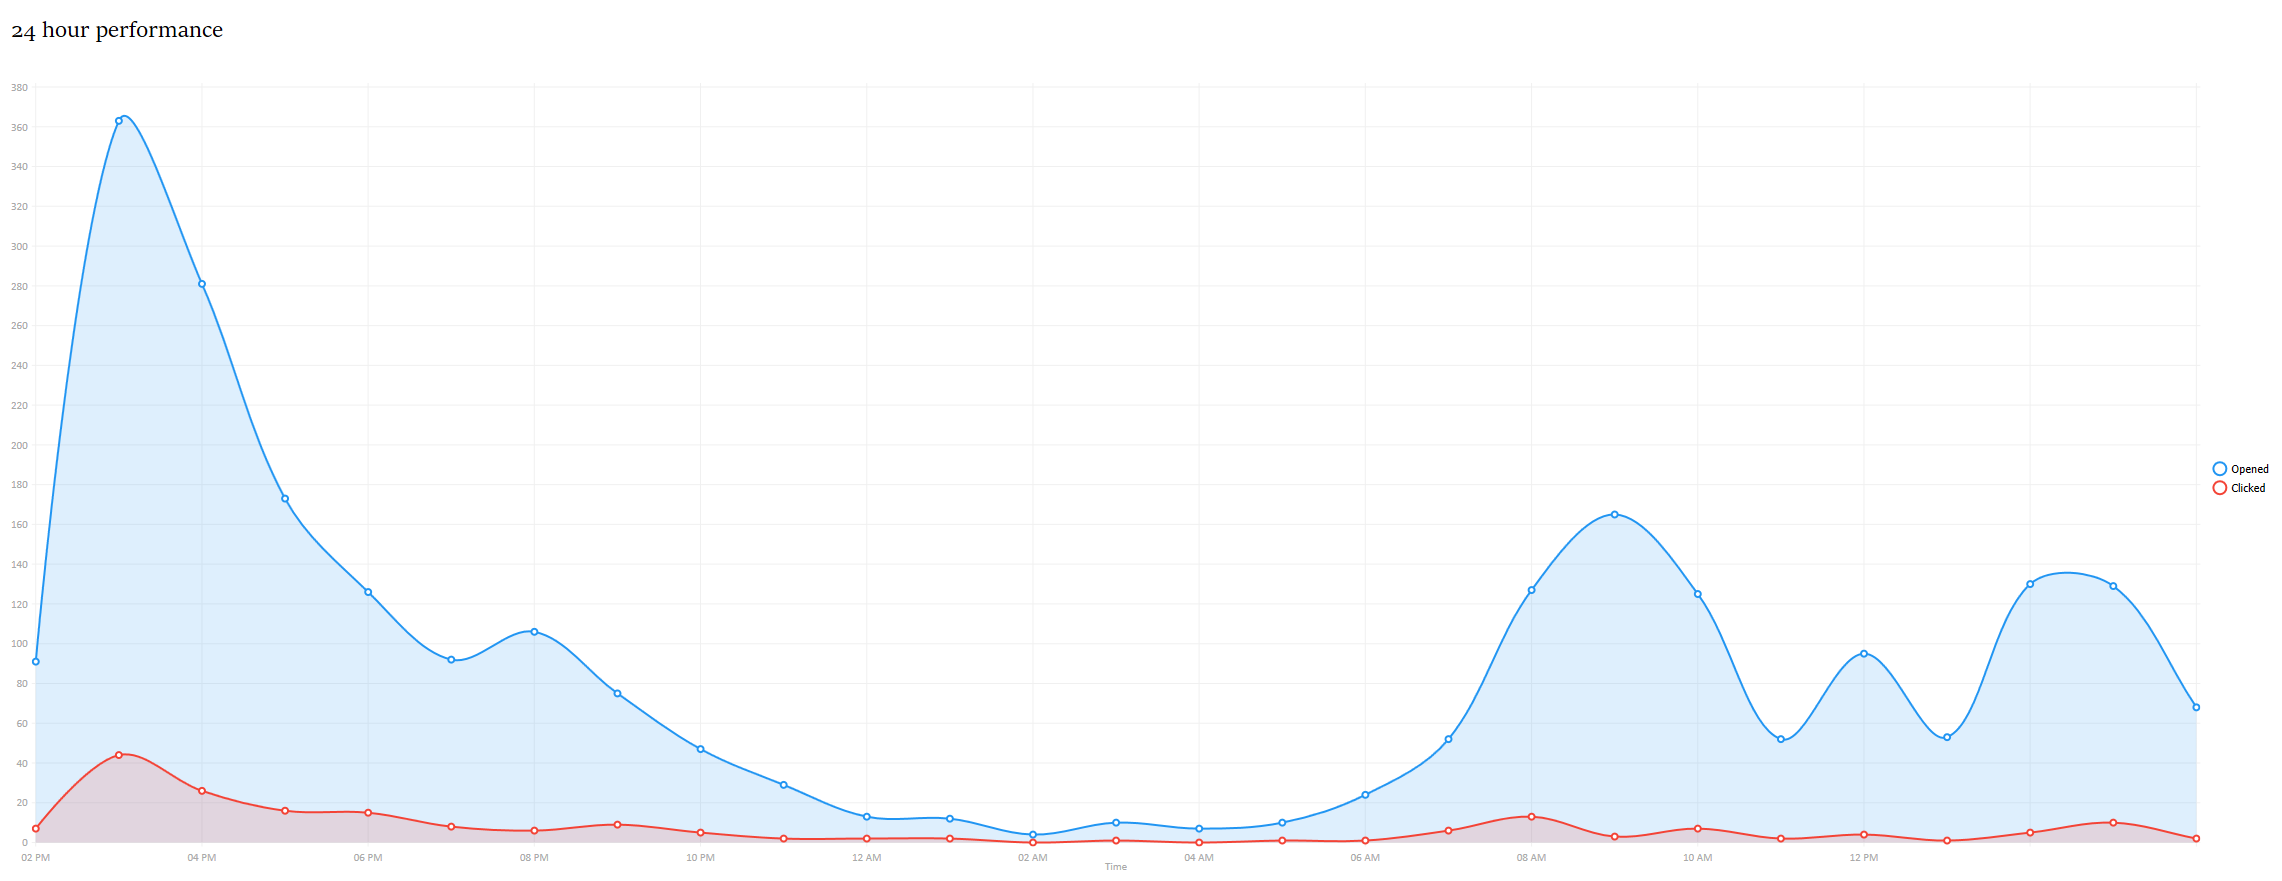
Below, you will see a 24-hour performance of how your campaign performed in a Line graph view
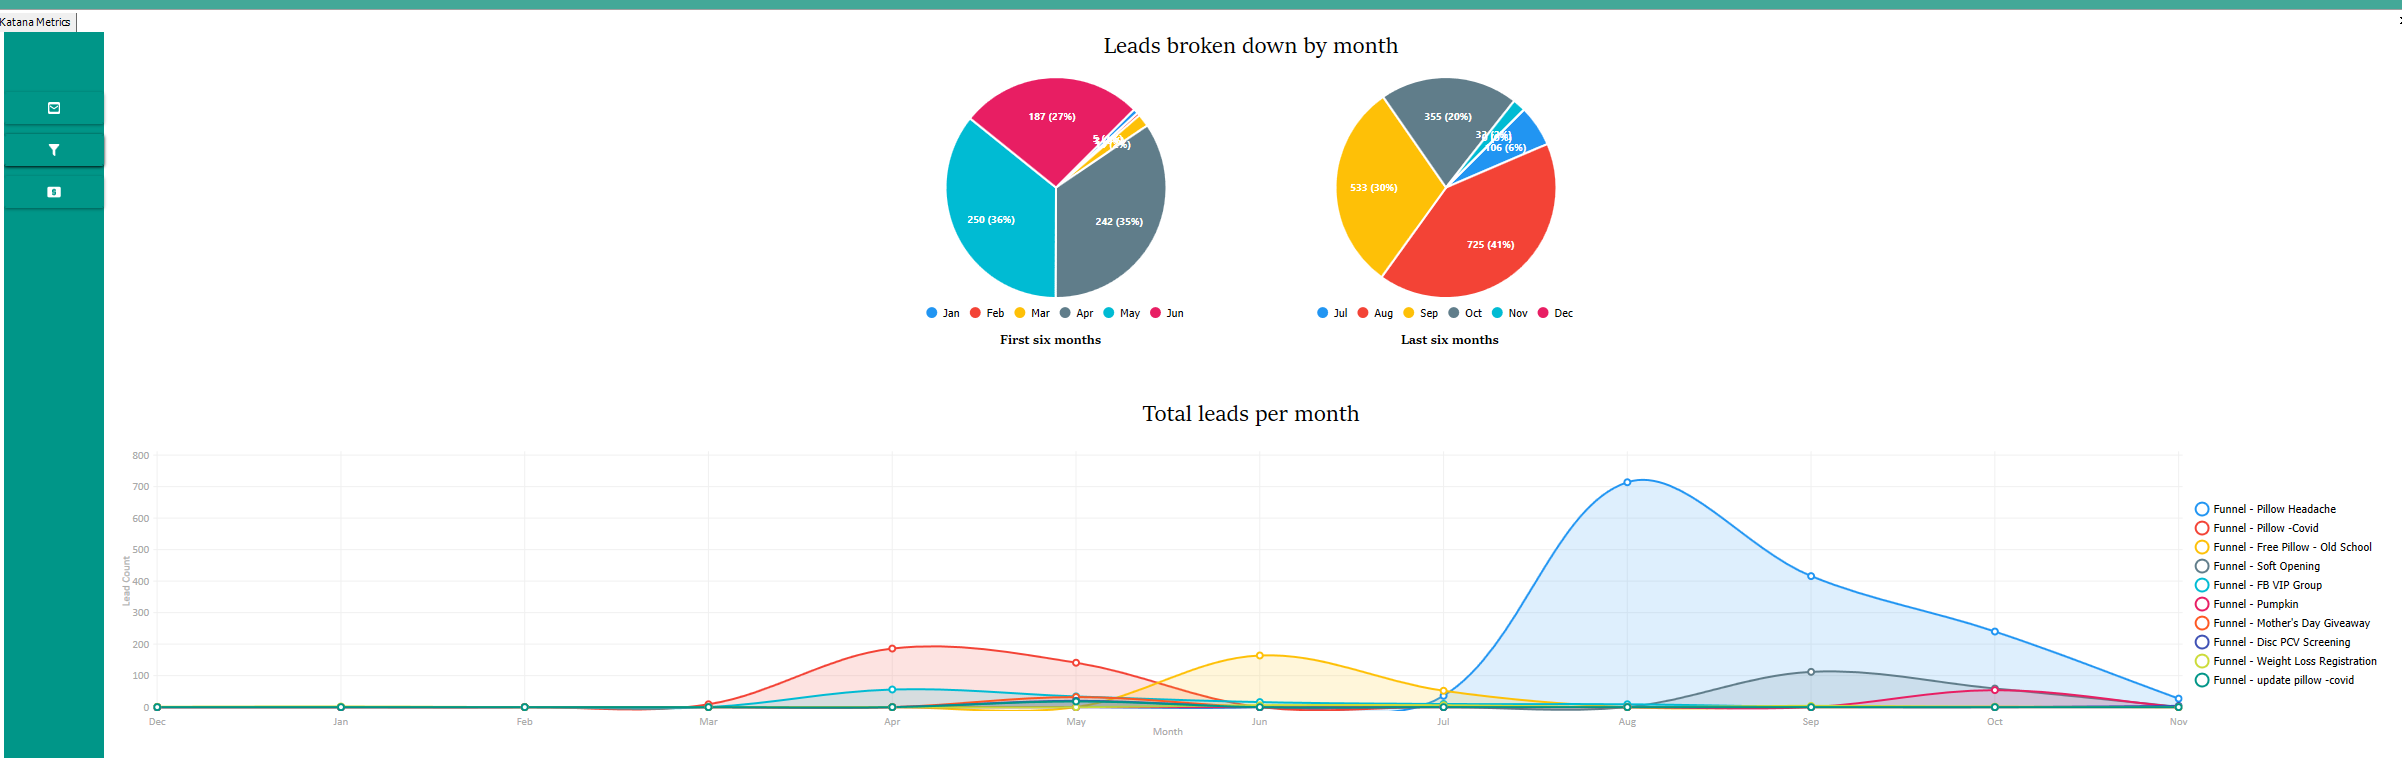
Funnel Matrix
In this location, you will see Leads broken down by Month within 2 pie charts.
1st 6 months and Last 6 months.
These graphs are helpful so you can see which funnels are performing the best.
You will also see a line graph with your funnels broke down on the right and what colors are associated.
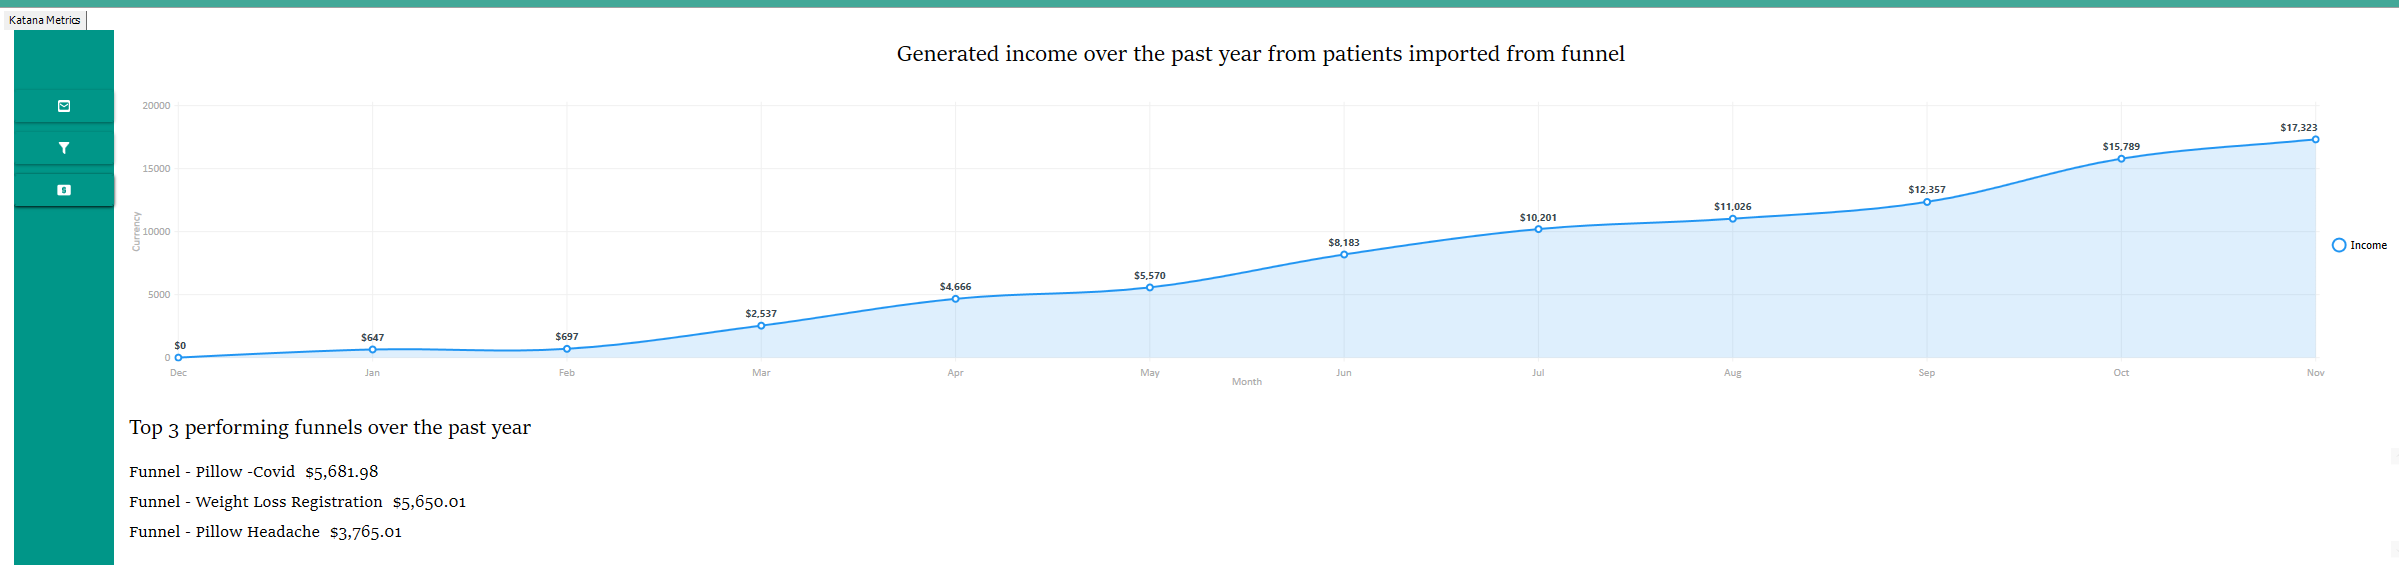
Income Generated
This location shows Generated Income over the past year from patients imported from a funnel.
If they are leads manually entered they will not be included in this statistic.
Below the graph, you will see a list of your top 3 income-generating funnels.
Keep in mind that if you do not see a funnel listed, that is because that funnel did not generate a lead that has physically paid money to the clinic. Once they do, the funnel will display.
We are increasing this amount to the top 25 in a future update.
- Support Information -
If you have any questions please contact Support by:
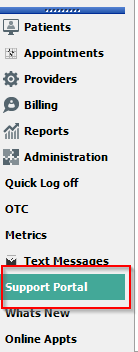
Live chat: Click the 'Support Portal' button in your main toolbar (on left-hand side), click the green 'Support' box in bottom right of screen.
***This has the fastest response time***
Phone: 909-378-9514
Email: support@coactionsoft.com
Business hours: Monday-Friday, 8:00am-6:00pm CST
Comments
0 comments
Article is closed for comments.